Where We’ve Been & What We’ve Learned
We Heard You | Traveler Feedback
During the spring and summer of 2019, CDOT spoke to residents in communities across the state. The common thread in all of those conversations was safety. Colorado’s transportation vision is for a future with zero deaths and serious injuries so all people using any transportation mode arrive at their destination safely.
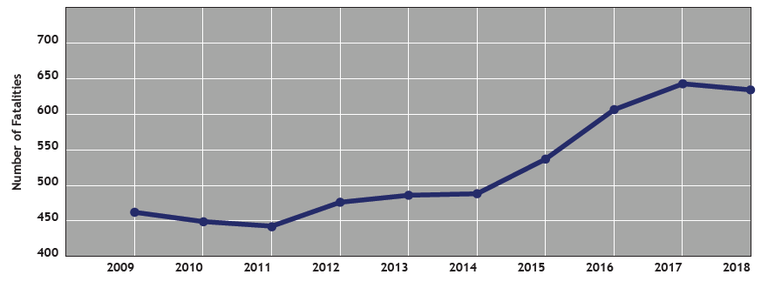
Crash rates and traffic fatalities are at concerning levels. A number of factors contribute to this, including:
- Population growth and hundreds of thousands more vehicles on our roads
- Speeding, impaired driving and distracted driving
- Lack of seat belt use
Colorado Traffic Fatalities 2009–2018

No number of fatalities can ever be acceptable. CDOT works to integrate safety into everything we do, focusing on both driver behavior and the built environment. The 10-Year Strategic Project Pipeline will focus on safety improvements both large and small such as meeting new federal design and installation standards/guidelines for guardrail and end-treatments, improving intersections to meet current ADA requirements and constructing new sections of passing lanes.
Types of Safety Improvements
- Intersection improvements
- Passing lanes
- Highway widening
- Shoulder widening
- Wildlife fencing
- Roundabouts
- Signal improvements
- Bottleneck reductions
- Slow vehicle / truck pullouts
- Pedestrian, bicycle, and bus stop safety improvements
Where We've Been
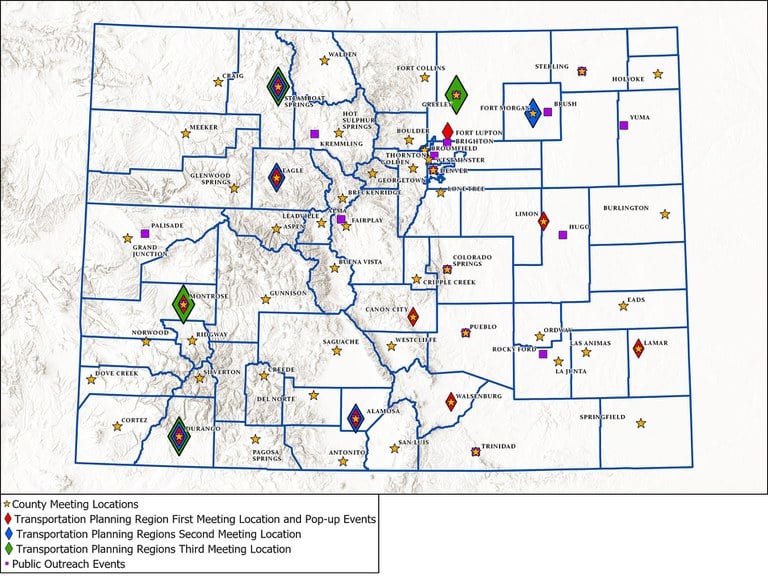
CDOT traveled to each of our 64 counties to talk with people about their transportation issues and goals at the local level. To ground these meetings with data, CDOT came prepared with presentations to spark discussion. To see what was discussed in your county, check out the presentations below.
We are also continuing to hold meetings throughout the state at the Transportation Planning Region (bundles of counties) level. These TPR meetings are also utilizing map-based presentations to ground discussion. Information from the digital survey and the county meetings are also available to review in the corridor summary sheets for each TPR. Take a look, and see what we learned from traveling the state and speaking to Coloradans like you.
What We Learned
To ground the conversations we held at each of the state’s 64 counties, CDOT prepared presentations that provided an overview of each county’s transportation conditions. Applicable safety, economic, and multimodal factors like: average daily traffic, floodplains, major employers, locations of community centers, bicycle traffic and crashes, and freight corridors were displayed in map form. Links to these presentations are available for review below.
From Transportation Planning Regions
To make planning and funding decisions, groups of counties are formed into transportation planning regions (TPRs), where elected officials are in charge of allocating funding and establishing priorities. After holding meetings with all 64 counties, information and feedback learned at those meetings, and from the online transportation survey (available to take here) were presented to the state’s 15 TPRs. You can see the presentations and feedback summary sheets for each TPR below.
Have a Comment?
Have a comment about any of the materials displayed above? Send us an email with your thoughts to [email protected].

